
Oak Island Market Chart
The chart below shows Adjusted Paid Occupancy levels for the Oak Island market from 2019 through the end of 2024 by month as of the date listed below
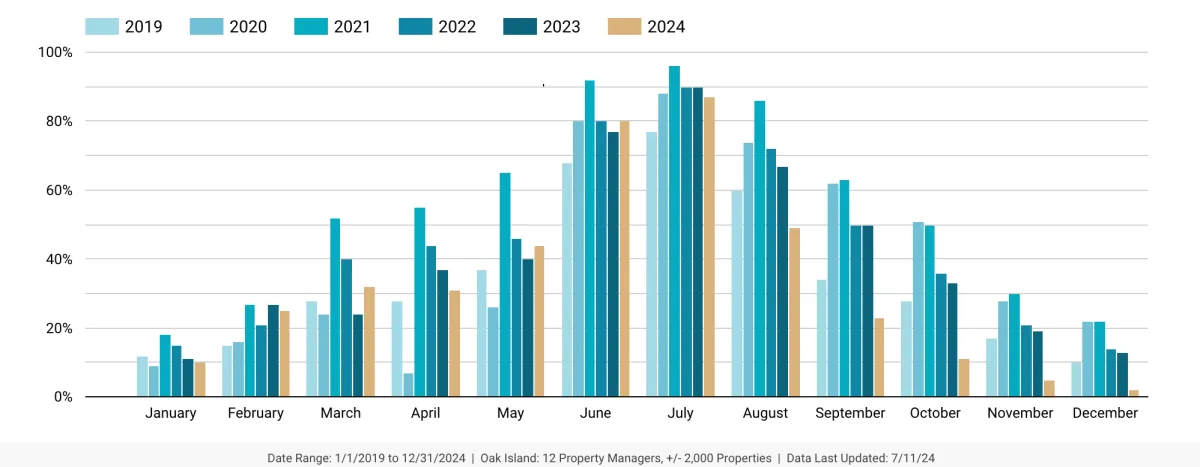
Data provided by Key Data Dashboard
© Copyright 2024 Salt and Sand Realty. All rights reserved.
Powered with 🩵 by Casavate Vacation Rental Marketing